Jon Udell writes about visual numeracy, introducing a new graph to continue the conversation about where the US gets its oil.
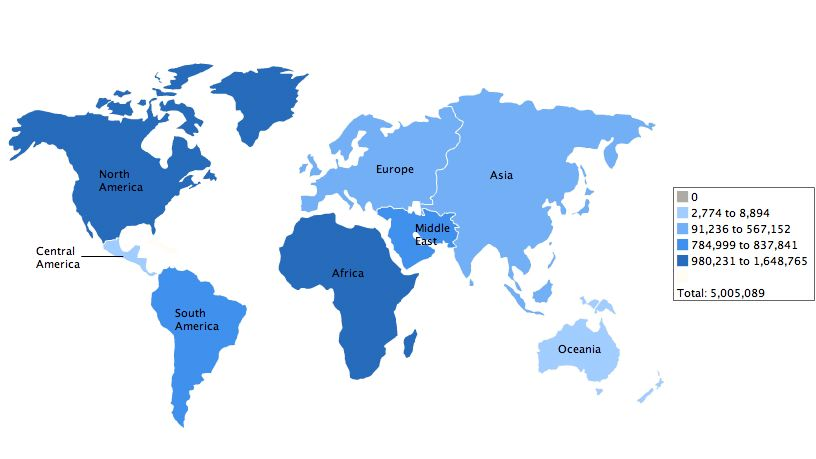
Here’s his original map of US oil imports by region:
Here’s his latest graph about where the global oil reserves are:
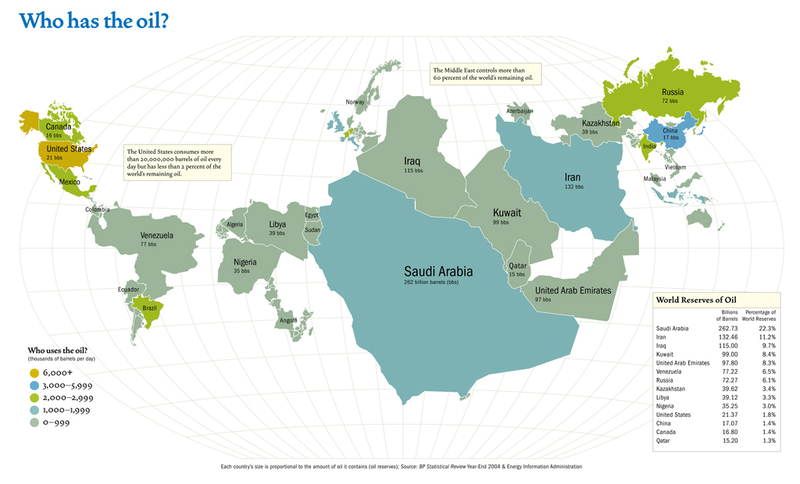
Comments on Udell’s latest post point out that this kind of graph is called a cartogram, which is a map where areas are scaled to indicate the scalar value of the statistic that is being displayed on the map.
My favorite (via Tony Hirst) is from a series on 2008 election results:
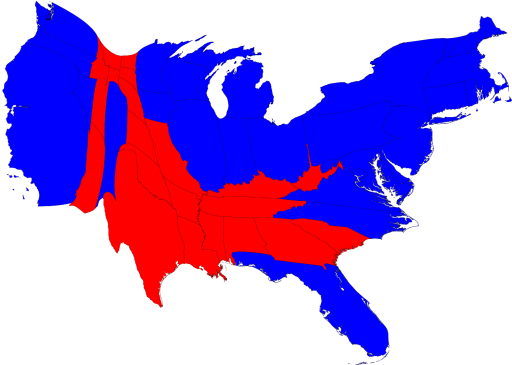
Popular vote results displayed on a map of the US.
Update: further reading in the comments reveals an interesting insight by Tim:
“The thing that irritates me about the first visualization is that by visualizing some data you imply that the data is important. But visualizations, like statistics can lie.
‘In fact, where the US gets its oil is almost completely irrelevant. The oil market is a world market. The transportation costs are startlingly small but-all things being equal-it’s easier to get oil from countries that are near you (and hard to get it from countries you don’t trade with).
“The ‘dangerous disconnect’ between American perception–the US is dependent on Middle Eastern oil–and the reality–we get a lot of our oil from Canada–is actually misunderstanding that is *healthier* than the misunderstanding the chart might lead one to take.
“Reading the chart one might imagine that, if the Middle East were plunged into a giant multi-state war, we’d be basically fine. Of course, unless the United States invaded Canada-and Africa, yay!-and commandeered all the oil for US consumption, we’d be in the grip of massive undersupply and a resulting rise in the price of oil.
It’s also worth saying that reserve numbers have all sorts of spin on them…
Personally, I think the graphs help illustrate the conversation. Your mind doesn’t have to do a double-step between a list of numbers and the narrative that discusses them. Graphing statistics helps tell a story, but as Tim says it is only part of the story. We need to fill in the causal effects and the consequence, and in doing so, draw conclusions and learn.

