Mathematician Martin Wattenberg interview by boston.com about his exhibit at the Boston Museum of Modern art. (via ACM TechNews)
“The traditional approach to visualization in science and business is to create something transparent and neutral – a telescope with clear glass,” he said as he roamed through the ICA exhibit. “But for an emotional approach, or an artistic approach, you want to bring a point of view. Not all data is interesting. The art is pointing the telescope at the right set of data.”
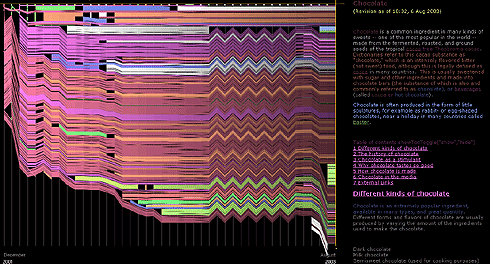
You can see his work online at bewitched.com. I had seen Market Map, Name Voyager, and others before, but History Flow was new to me which visualized the editing history of wikipedia articles:
